Incident intelligence
Every firing rule becomes a cheap, disposable alert. Only the ones that are sustained, correlated and worth waking someone for get promoted to an incident.
Private betaLimited spots — no credit card required.
payments-api is critical
OOMKilled · restart ×3
Container OOMKilled 3 times · firing for 5m
payments-api · ip-10-0-1-23 · Sep 4, 16:09:19
Rollout v2.13 → v2.14 pushed memory past the 512Mi limit
deployed 16:03 · memory ceiling 16:09 · error rate 19.82% ≥ 10%
Investigate →One health model
Logs, traces, Kubernetes events, metrics, uptime checks and network telemetry all produce the same kind of alert, scored by the same health model. No per-source special-casing, so no two screens can disagree about whether something is wrong.
The mechanism
Every breach becomes an alert, allowed to be noisy, transient and self-resolving. An incident is a deliberate promotion of those alerts — and that promotion is the only place an incident is ever born.
Uptime checks, Kubernetes events, OTLP traces, host metrics and your own rules all produce the same object, scored by one health model. No per-source special-casing, so no two screens can disagree.
A pod that restarts and recovers in thirty-one seconds fires an alert and clears it. So does a one-minute upstream hiccup. They stay visible in the inbox and they never reach a phone.
Alerts that persist, cluster around one entity, or describe one failure collapse into a single incident — with every contributing alert attached as evidence, an owner, and a page.
01Detect
Monitors across HTTP, TCP, ping, DNS, gRPC and SSL certificates, plus heartbeat checks for the cron jobs that should have reported in.
Not one slow response. A degraded check is amber in the record and nothing else — the product’s own check policy, stated in the panel.
24h, 7d and 30d, colour-coded by threshold. Not “one-hour uptime.”
Cron jobs and workers that should have checked in and didn’t fire the same kind of alert as a failed request.
APM service health, the dependency map and cluster verdicts all feed the same alert spine.
02Explain
Every incident leads with a likely cause and the confidence behind it, derived from what actually changed in the window.
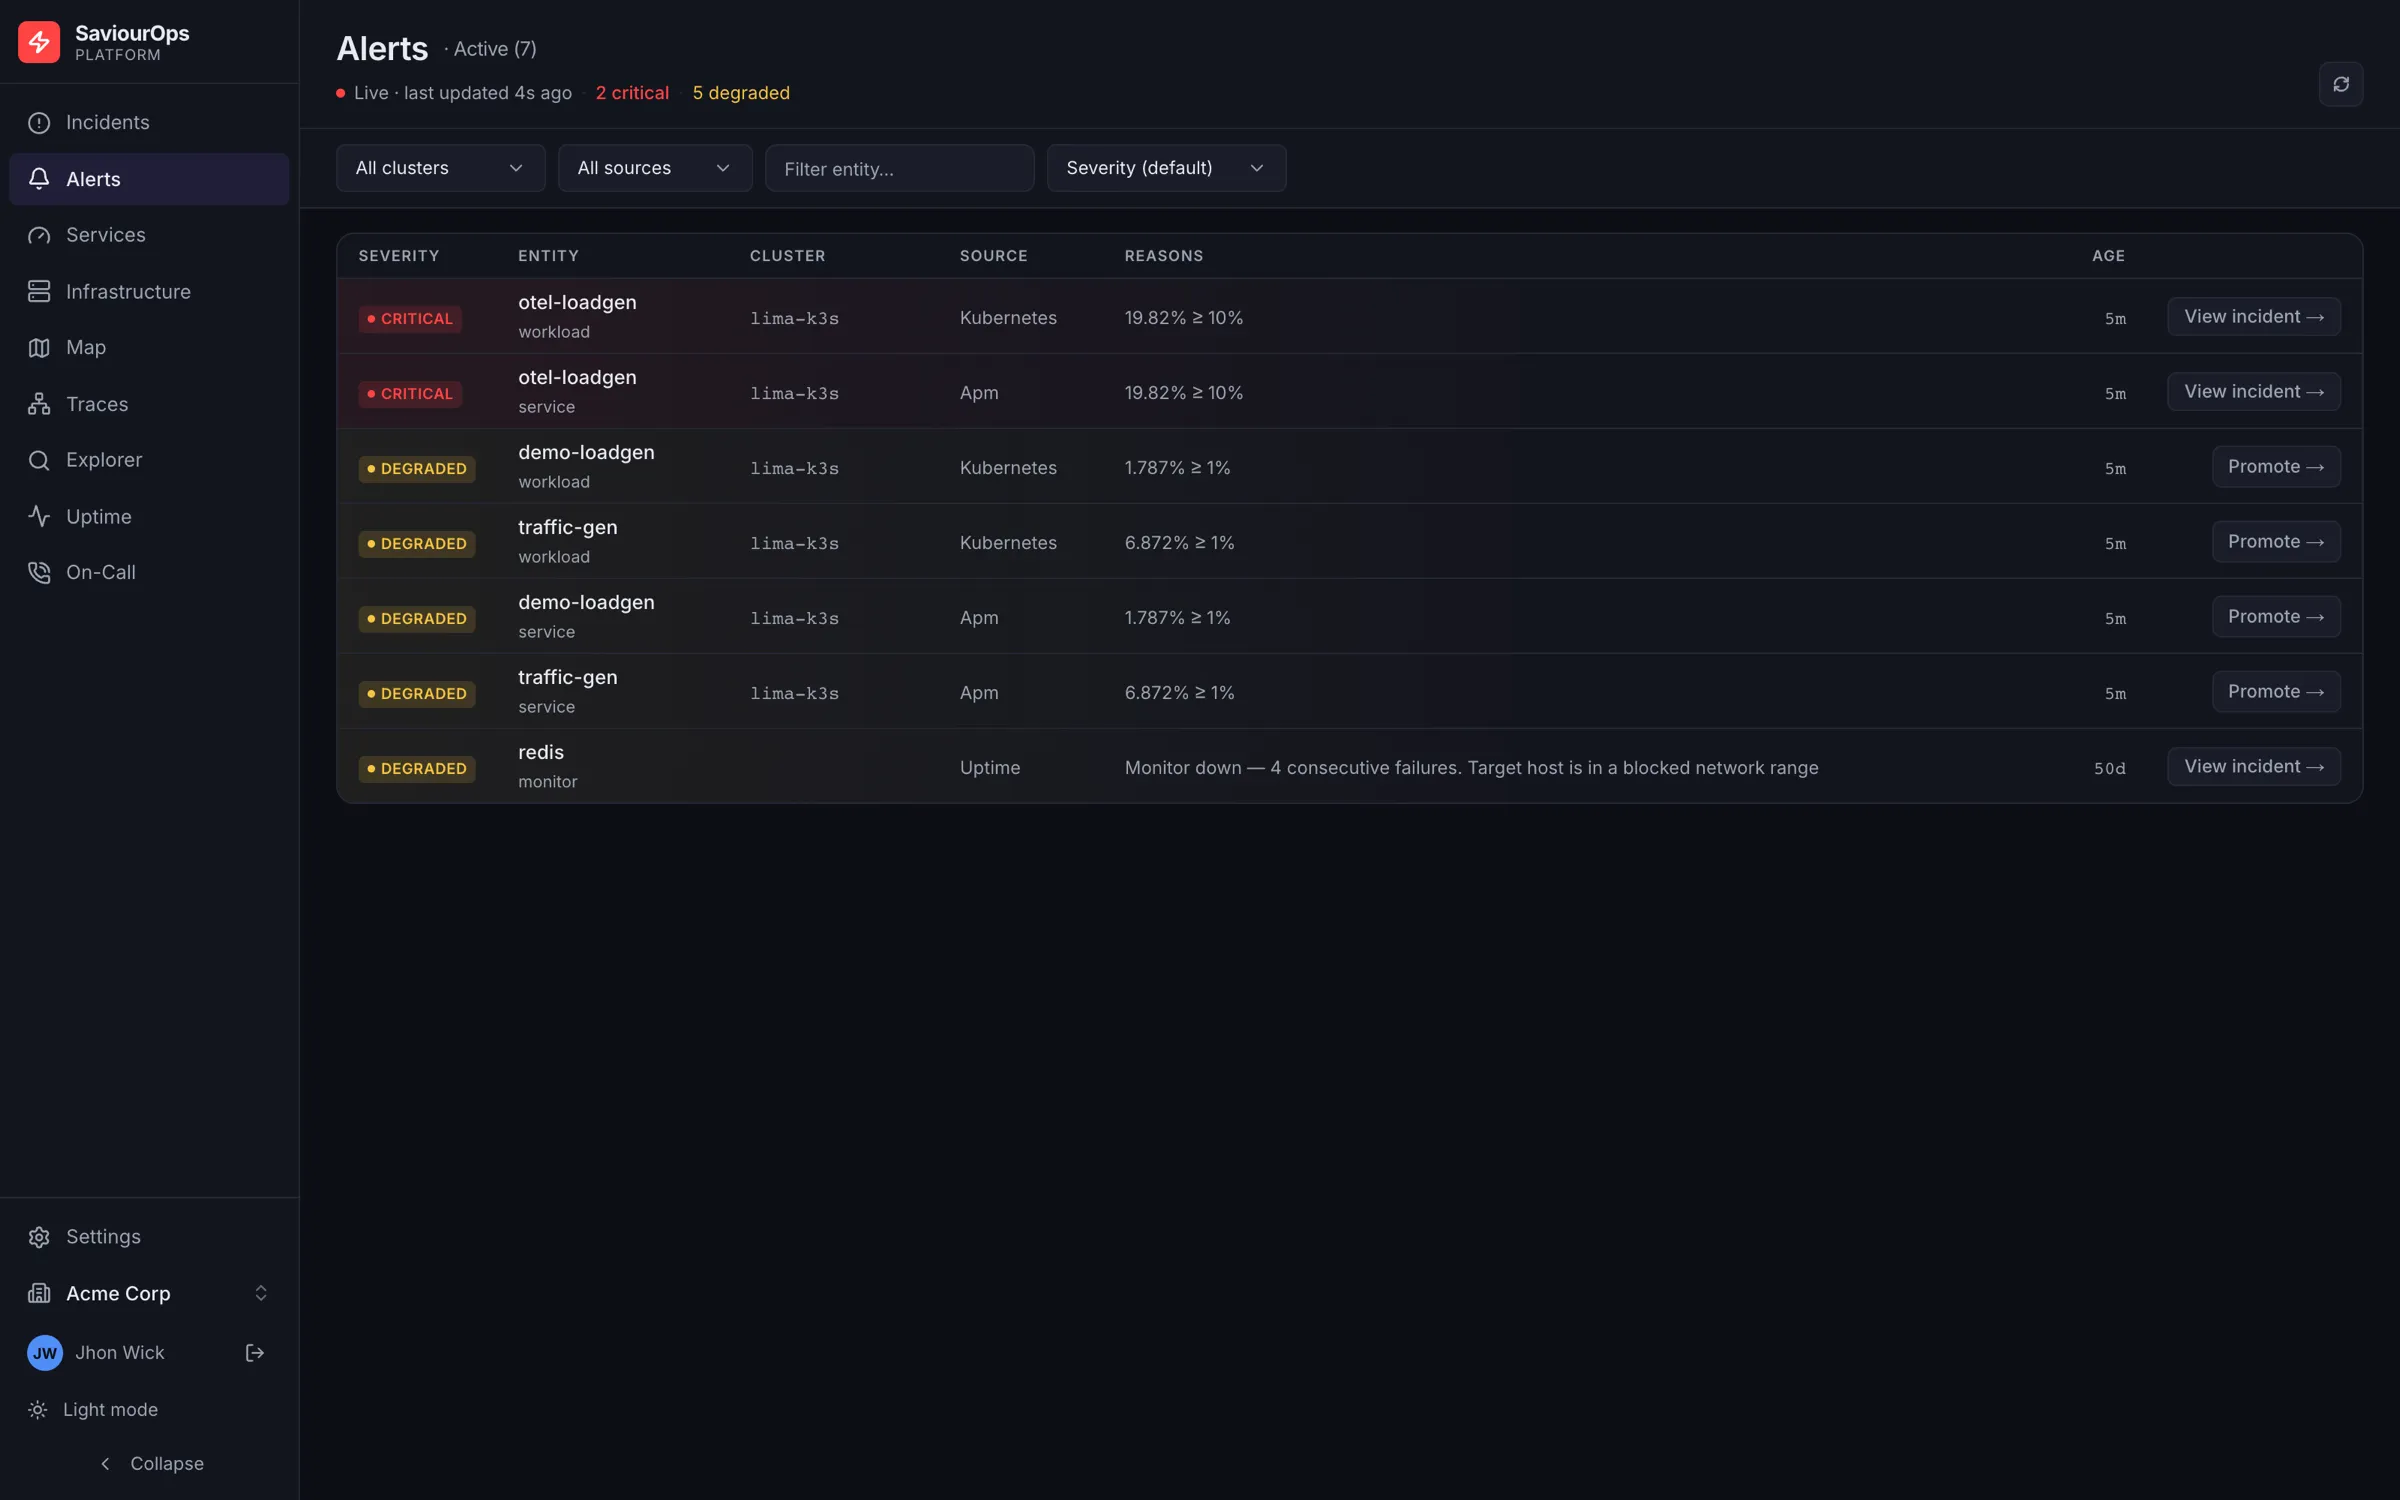
Image rollouts, deploys and Kubernetes patterns produce the verdict. The model only enriches it, so it still works when the model is unavailable.
If there was no change in the window it says so and leads with the symptom instead of inventing a cause.
Every contributing alert, the correlated timeline, the blast radius and similar past incidents sit on the incident itself.
Logs, metrics, HTTP, DNS and database queries in one search surface, with facets, live tail and pattern grouping.
03Respond
Schedules and rotations, multi-level escalation, overrides and shift swaps — and a public status page that updates from the same incident.
Cover a shift, hand it back, and see who is actually on call right now rather than who the rota says should be.
Which channel, to whom, when, and whether it was acknowledged. No more “did the page go out?”
A channel per incident with the verdict and timeline posted in, plus PagerDuty, SMS, phone, Discord, Telegram and webhooks.
On-call is in the free tier. If you would rather keep PagerDuty, it is a supported channel.
04Kubernetes
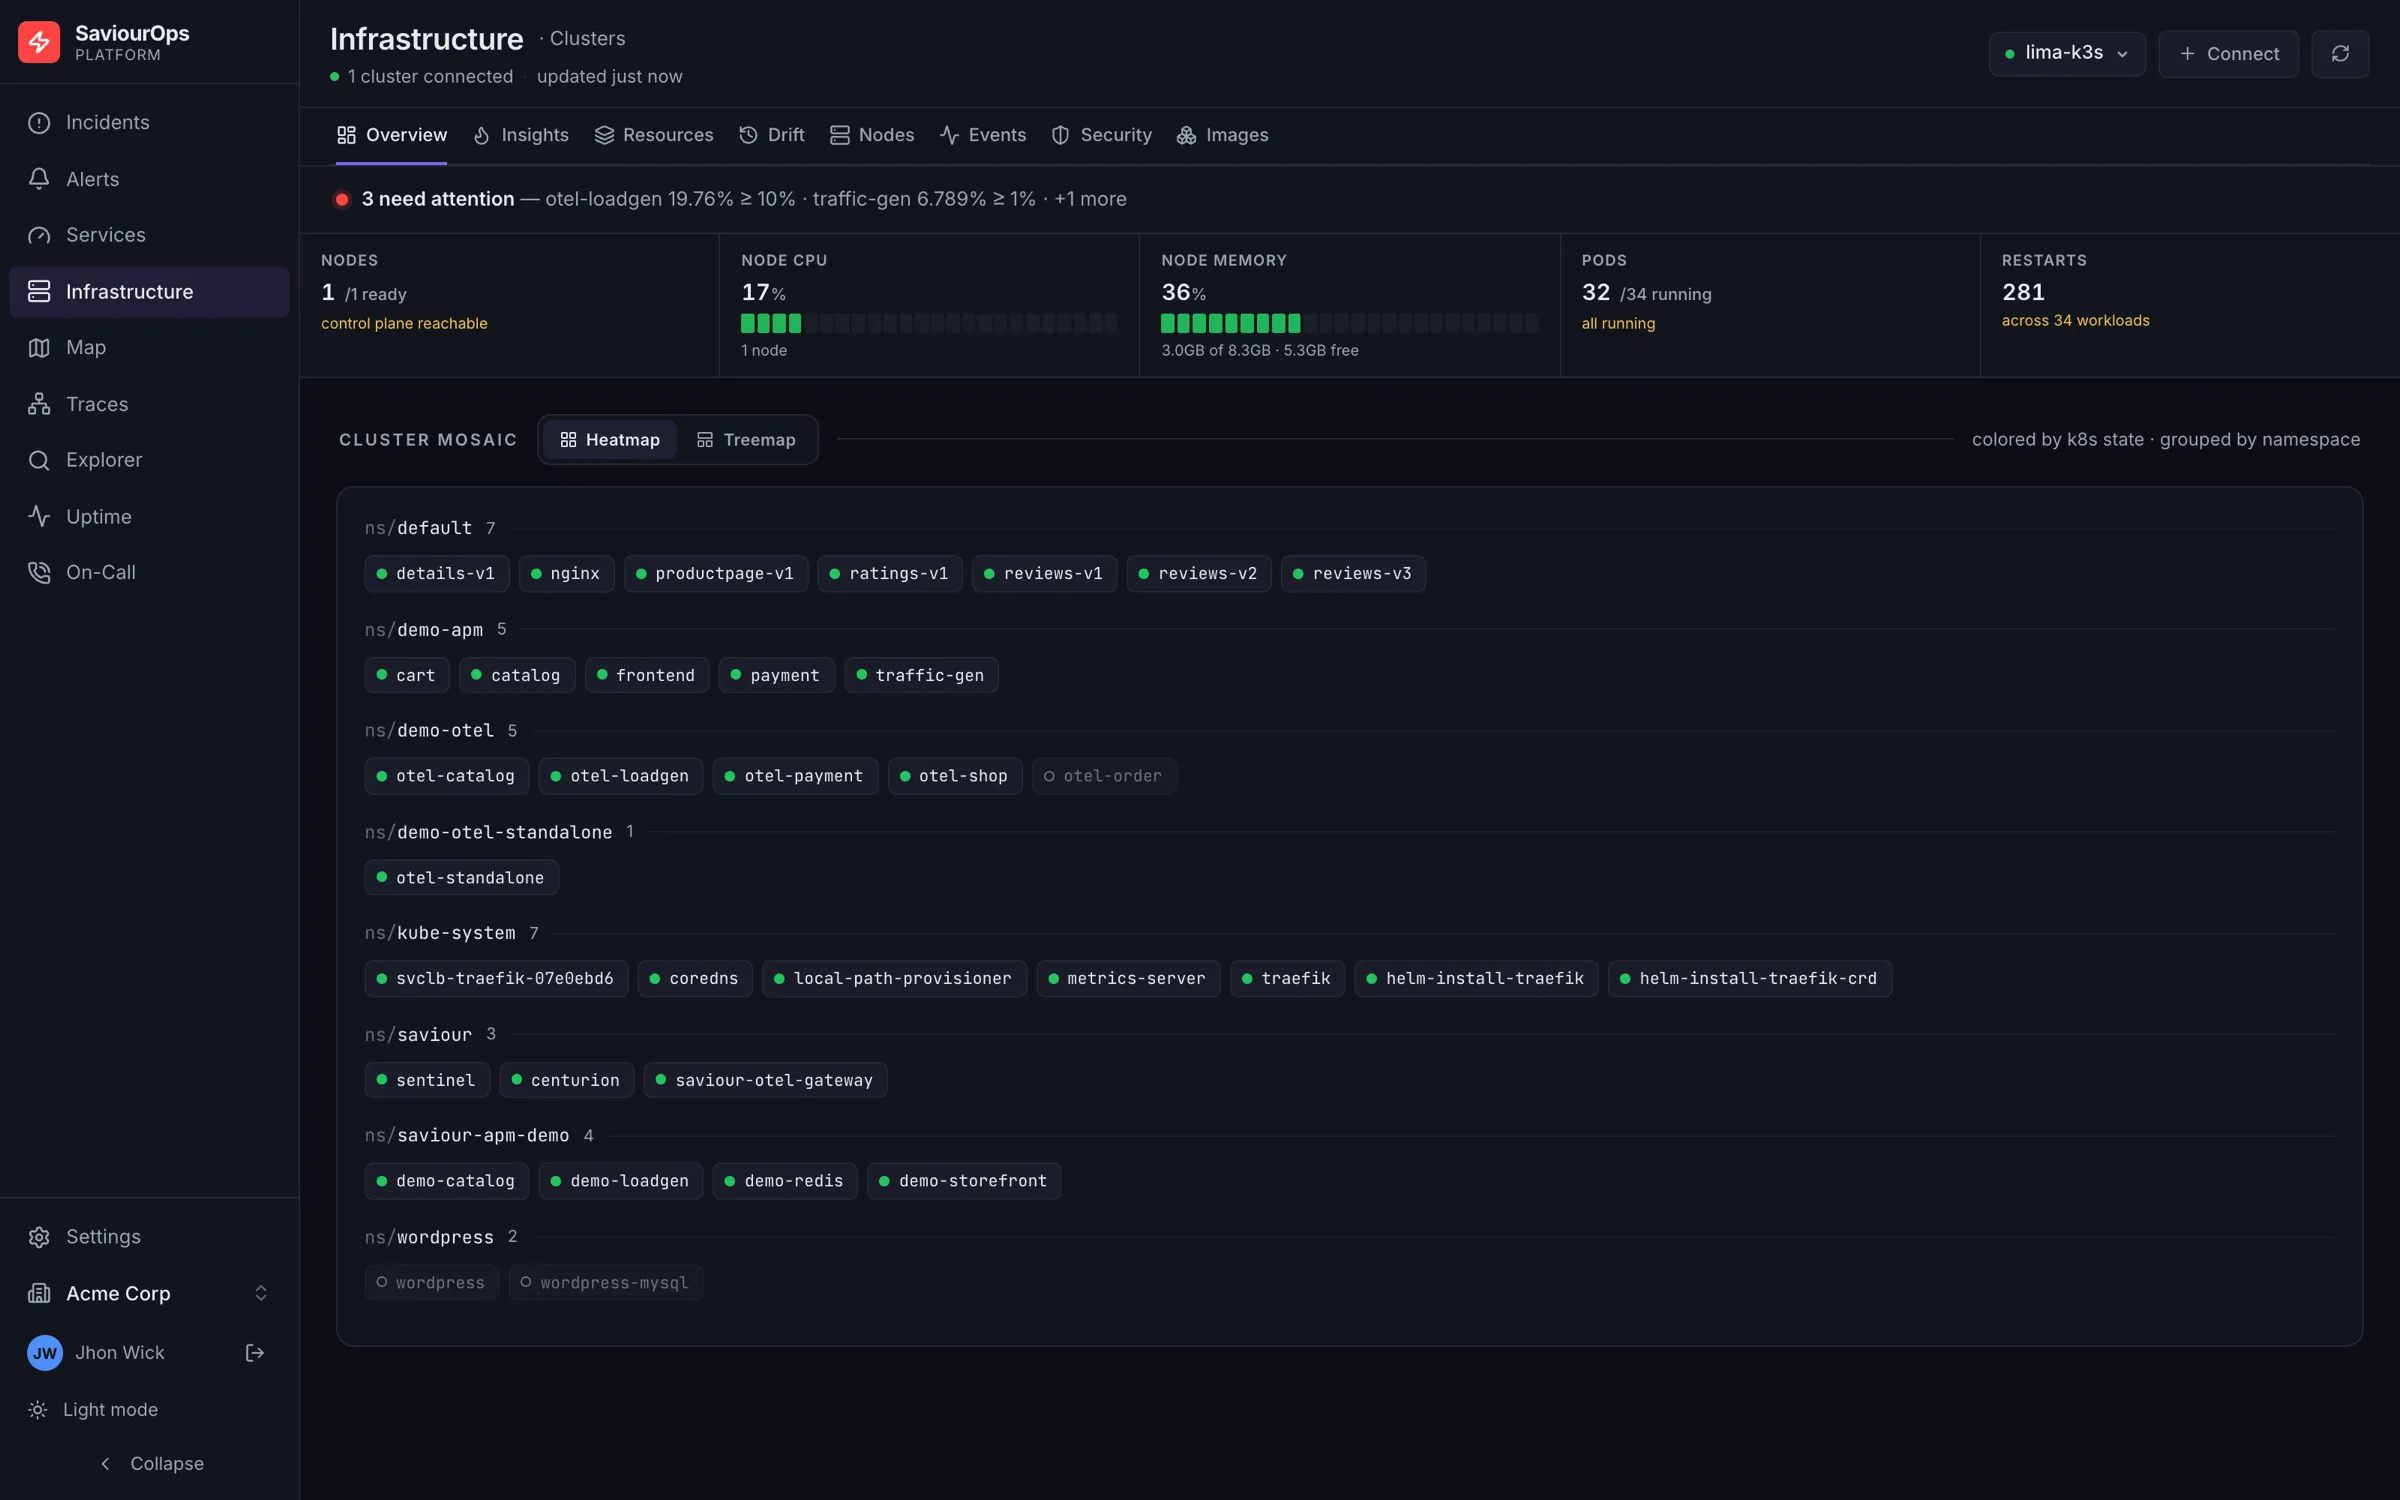
A cluster is where alert storms are born. One node runs out of memory and every workload on it dies at once — this is the case promotion was built for.

Five failing pods of one Deployment count as one symptom — workloads are keyed by root owner, so a thrashing ReplicaSet cannot inflate the count. A storm needs three distinct workloads within thirty minutes on one node.
ImagePullBackOff across four namespaces reads as a registry problem, not four unrelated deployment failures.
All quiet — 30 workloads healthy · 1/1 nodes · last change 42m ago, or what needs attention and for how long.
Image rollouts, manifest edits and scale events — the change history that makes a likely-cause verdict possible at all.
Questions
Those tools fire on a rule and forward the result. There is no object representing “currently firing” that can be deduplicated or correlated before it becomes a page. SaviourOps makes that object first-class, so grouping and suppression happen before anyone is notified rather than after.
No. The host agent collects HTTP, DNS, database-query and connection events from the kernel with eBPF, so you get request-level detail without touching application code. If you already emit OpenTelemetry traces, point them at the ingestion endpoint and they are correlated alongside.
It still works. Likely cause is derived deterministically from image changes, deploys and Kubernetes patterns; the model only enriches that result. If nothing changed in the window, the verdict says so and leads with the symptom instead of inventing a cause.
On Enterprise, yes — the platform runs as a set of services against your own PostgreSQL and ClickHouse. On the cloud version, an in-cluster OpenTelemetry gateway keeps the ingestion key out of individual app deployments.
It covers the same ground — schedules, rotations, multi-level escalation, overrides and shift swaps — and it is included rather than billed separately. If you would rather keep PagerDuty, it is a supported alert channel.
Connect one cluster and watch a week of alerts sort themselves into the handful that actually mattered.